Usage
There are two main functions:
harm_analysis: for simulations with an injected tone, returning SNR, THDN, Noise, etc.spec_analysis: for cases without an injected tone, that auto-detects DC, tones, and noise from the spectrum.
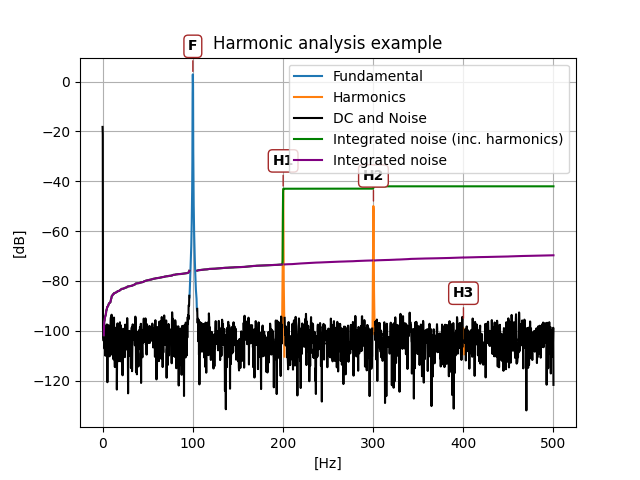
harm_analysis example usage
This example generates a tone with noise, harmonics and a DC value.
"""Example usage of the harm_analysis function."""

import matplotlib.pyplot as plt
import numpy as np

from harm_analysis import harm_analysis

# test signal
N = 4096
fs = 1000
t = np.arange(0, N / fs, 1 / fs)
F1 = 100.13

noise = np.random.normal(loc=0, scale=10 ** (-70 / 20), size=len(t))

# Test signal
# Tone with harmonics, DC and white gaussian noise
x = (
    noise
    + 0.1234
    + 2 * np.cos(2 * np.pi * F1 * t)  # Fundamental
    + 0.01 * np.cos(2 * np.pi * F1 * 2 * t)
    + 0.005 * np.cos(2 * np.pi * F1 * 3 * t)
)

# Use the harm_analysis function
fig, ax = plt.subplots()
parameters, ax = harm_analysis(x, fs=fs, plot=True, ax=ax)

print("Parameters:")
for key, value in parameters.items():
    print(f"{key}: {value}")

# Show plot
ax.set_title("Harmonic analysis example")
fig.savefig("./docs/images/example_usage.png")
outputs:
examples/example_usage.md
Parameters:
fund_db: 3.0103178431927984
fund_freq: 100.12999868882139
harm_freq: [200.25986956 300.38945435 400.20134394]
harm_db: [-43.00093913 -49.03890458 -96.13740204]
dc_db: -16.414175351690197
noise_db: -69.72556277378999
thd_db: -45.045607514047404
snr_db: 72.73588061698278
sinad_db: 45.03822188200353
thdn_db: -45.03822188200353
total_noise_and_dist_db: -69.72556277378999
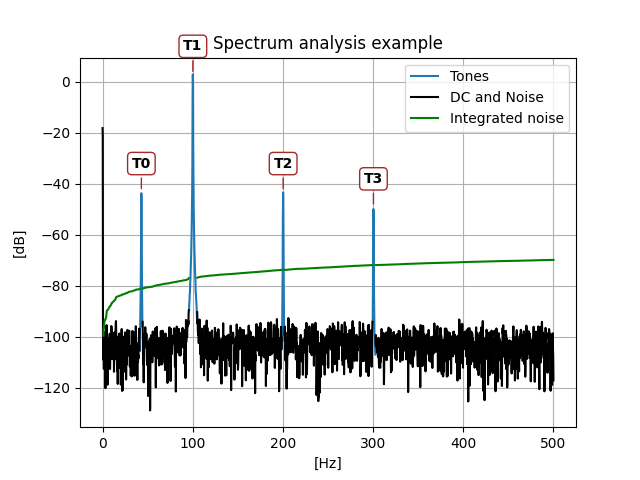
spec_analysis example usage
"""Example usage of the spec_analysis function."""

import matplotlib.pyplot as plt
import numpy as np

from harm_analysis import spec_analysis

# test signal
N = 4096
fs = 1000
t = np.arange(0, N / fs, 1 / fs)
F1 = 100.13

noise = np.random.normal(loc=0, scale=10 ** (-70 / 20), size=len(t))

# Test signal
# Tone with harmonics, DC and white gaussian noise
x = (
    noise
    + 0.1234
    + 2 * np.cos(2 * np.pi * F1 * t)
    + 0.01 * np.cos(2 * np.pi * F1 * 2 * t)
    + 0.005 * np.cos(2 * np.pi * F1 * 3 * t)
    + 0.01 * np.cos(2 * np.pi * F1 * 0.43 * t)
)

# Use the harm_analysis function
fig, ax = plt.subplots()
results, ax = spec_analysis(x, fs=fs, plot=True, ax=ax)

print("Function results:")
for key, value in results.items():
    print(f"{key}: {value}")

# Show plot
ax.set_title("Spectrum analysis example")
fig.savefig("./docs/images/example_spec_analysis.png")
outputs:
examples/example_spec_analysis.md
Function results:
dc: 0.12340892002472457
dc_db: -18.173068965292313
noise_db: -69.88881400352892
tones_db: [-43.00264669   3.01033846 -43.00849511 -49.01269433]
tones_freq: [ 43.0553679  100.13000021 200.25987669 300.39077327]